
A display can look perfectly fine until you measure its white point. My Dell Alienware AW2724DM was a good example: gamma was already close to the usual SDR target, yet its whites were noticeably cooler than D65. For this Datacolor SpyderPro review, I wanted to see what the sensor could actually tell me about the screen, not just whether its calibration wizard was easy to finish.
I worked through gamut coverage, SDR brightness, contrast, 12-patch color accuracy, screen uniformity and a FullCAL profile using SpyderPro 6.5 on Windows 11. I also tried Windows HDR afterward, which exposed a practical limitation worth knowing before buying a colorimeter for an OLED or high-brightness display.
The Setup I Used for Every Measurement
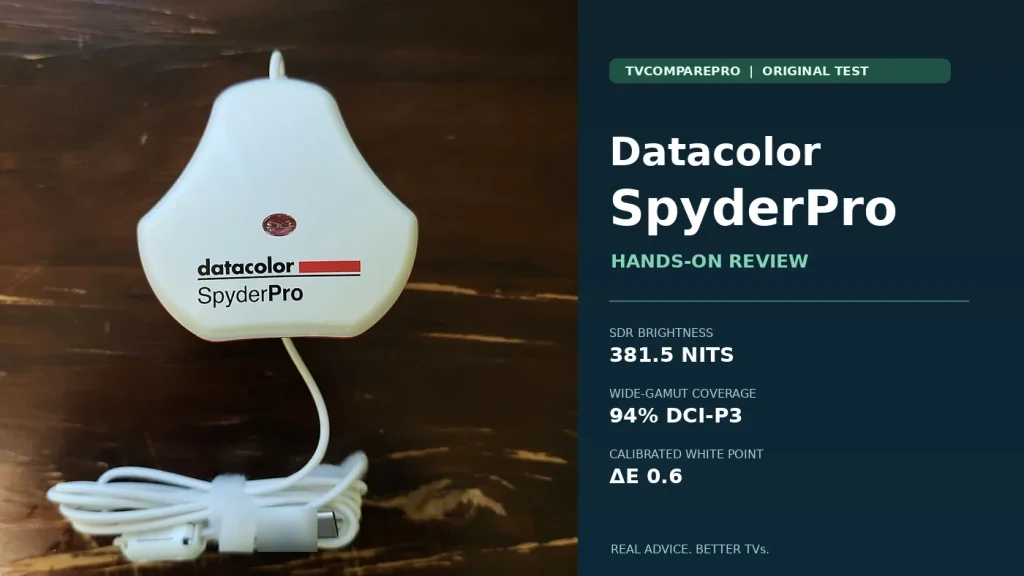
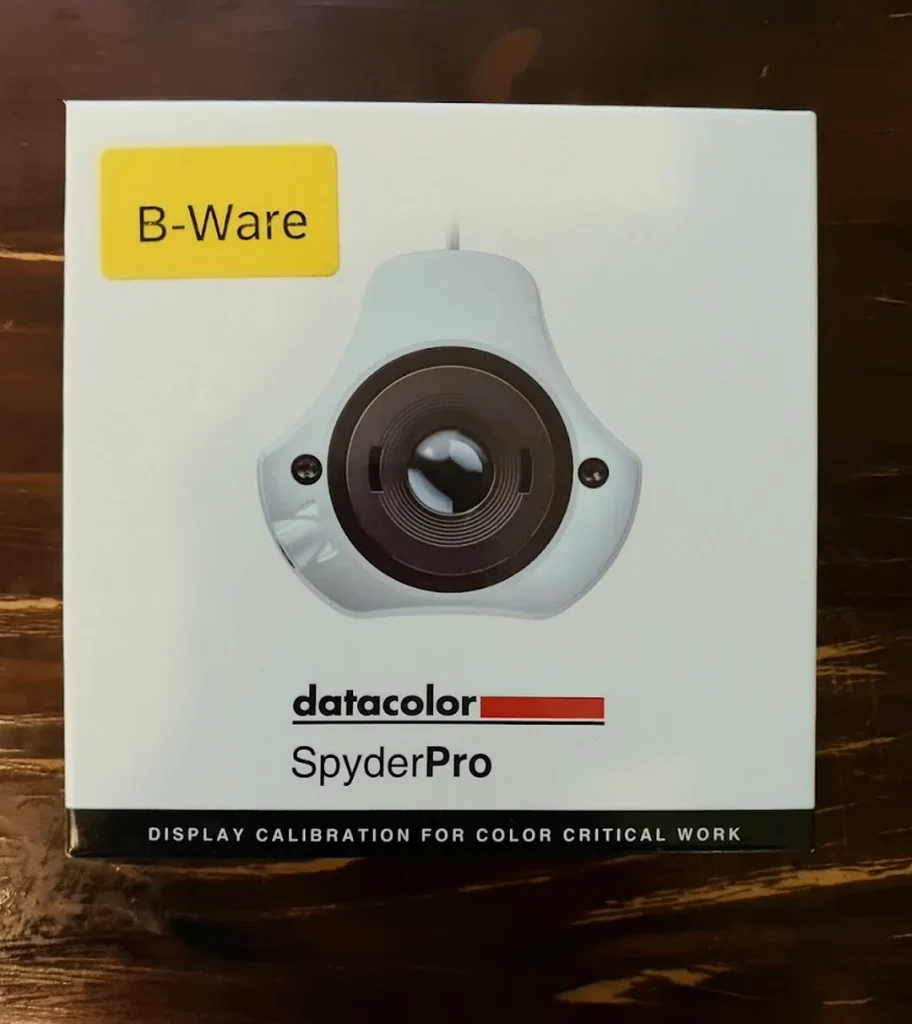
I used the 2024 SpyderPro hardware with software version 6.5 and a 27-inch Alienware AW2724DM Fast IPS monitor. For the SDR tests, Windows HDR was off, the monitor stayed in its Standard picture preset and I selected Wide LED in Datacolor’s display-technology list. I did not switch to Custom Color or manually change the monitor’s RGB gain controls. That last point matters: the calibration results below reflect the software workflow I actually used, not a hardware-level three-channel adjustment.
| Part of the setup | Recorded configuration |
|---|---|
| Instrument | Datacolor SpyderPro (2024) review unit |
| Software | SpyderPro 6.5 on Windows 11 |
| Display | Dell Alienware AW2724DM, 27-inch Fast IPS |
| OSD picture preset | Standard |
| Datacolor display technology | Wide LED |
| Windows HDR | Off during SDR tests and FullCAL |
| Calibration | FullCAL, gamma 2.2, 6500 K target |
| Monitor RGB gains | Left untouched; no Custom Color mode |
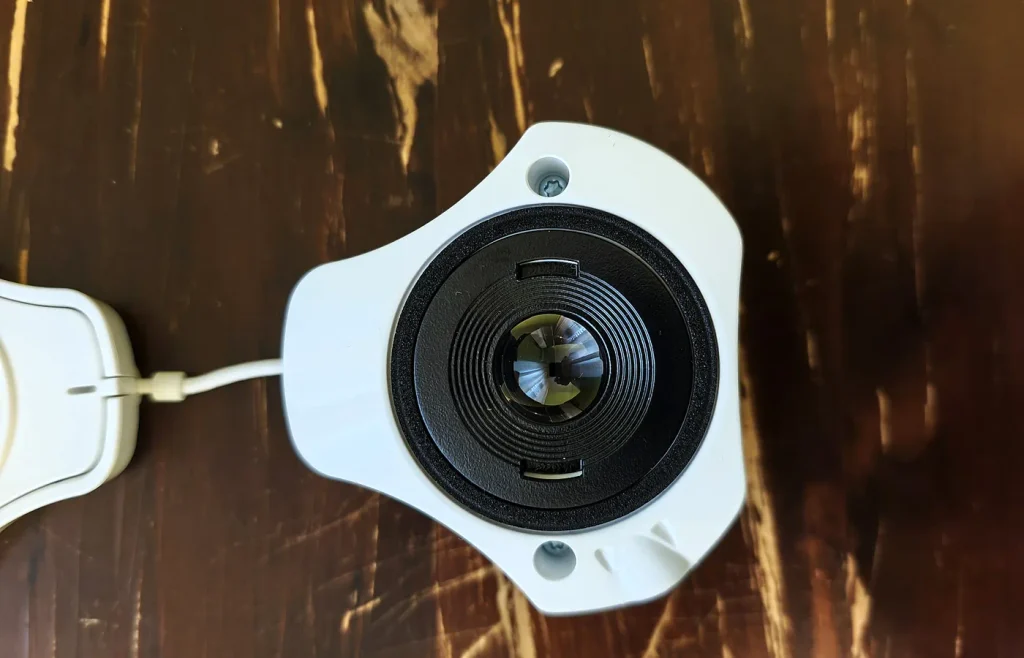
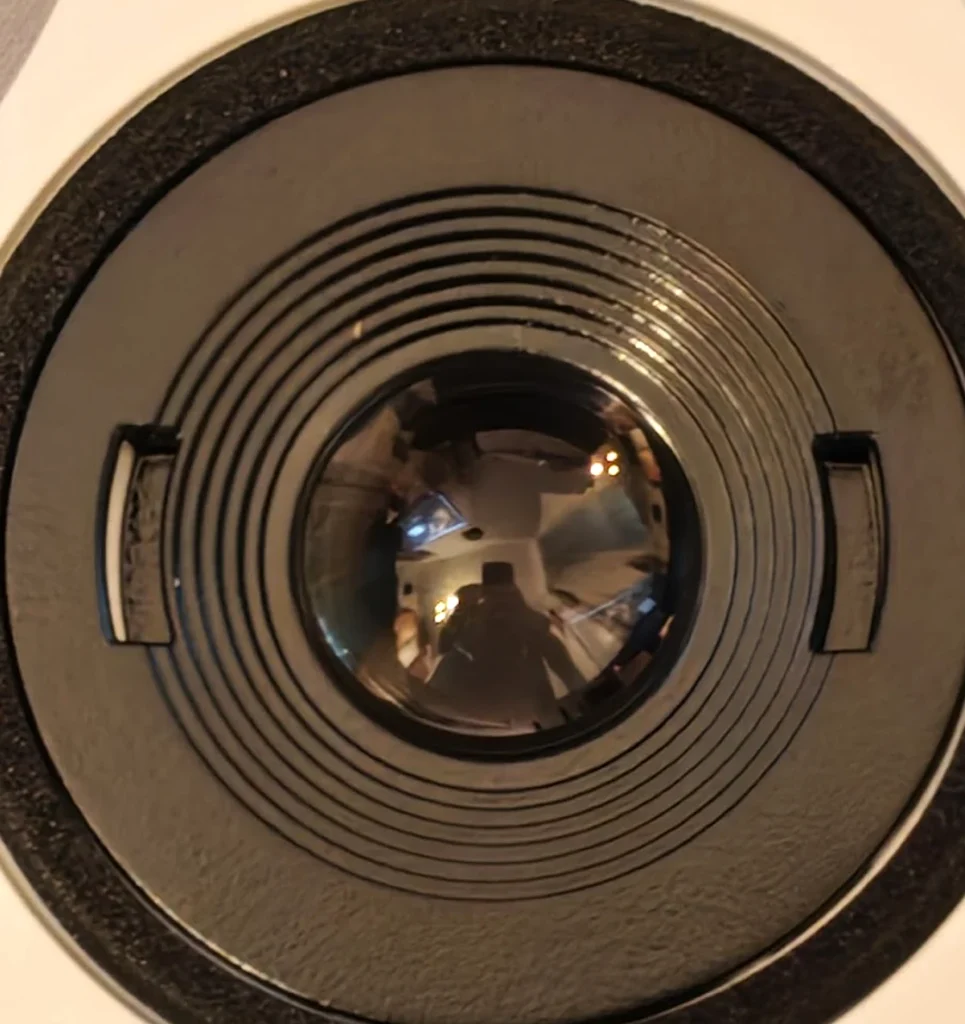
The sensor hangs against the panel while the software shows test patches beneath its optical window. Its cable and counterweight help keep the measuring head flat. I worked through the Display Analysis reports first, then created an ICC profile and reviewed the before-and-after results. As with any instrument reading, these are observations from one display and one setup, not a promise that every AW2724DM will measure identically.
What the SpyderPro Actually Offers
The SpyderPro hardware uses USB-C, with a USB-A adapter included. In software, it supports different display technologies, including standard and wide-gamut LED, mini-LED, OLED and QD-OLED. The headline capability is a stated luminance-measurement ceiling of 12,000 nits, alongside custom calibration targets, multi-display matching, display analysis and 3D LUT export. It is a substantial toolset, but I would not judge a colorimeter on its advertised maximum nit figure alone.
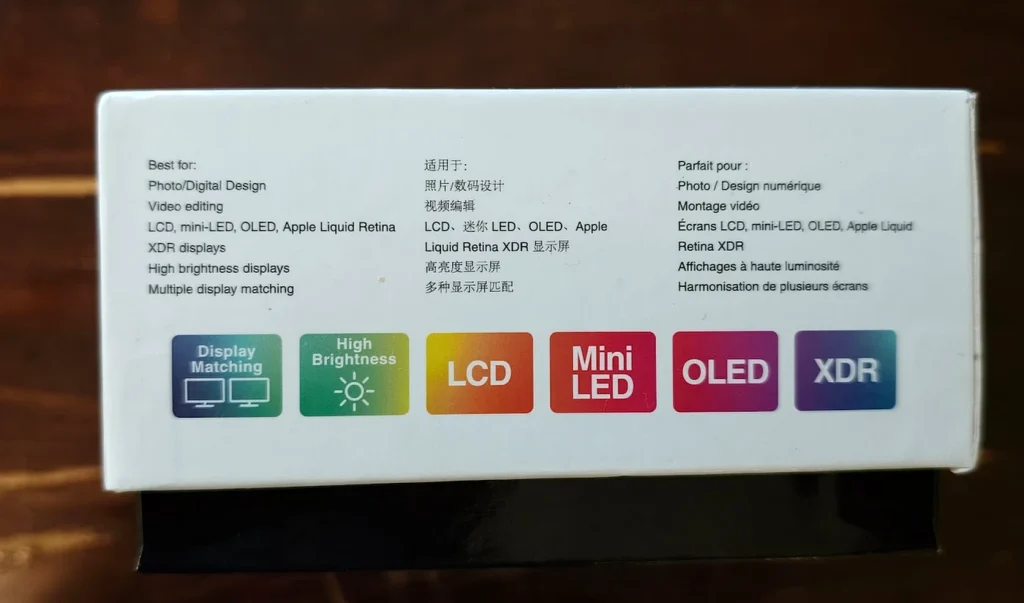
| Feature | SpyderPro capability | My test status |
|---|---|---|
| Maximum luminance range | Up to 12,000 cd/m², manufacturer specification | High-brightness display measurements |
| Display types | LCD, wide LED, mini-LED, OLED, QD-OLED, Apple XDR and more | Tested one Fast IPS / Wide LED monitor |
| ICC profiling | Windows and macOS standard display profiling | Tested on Windows 11 |
| Display analysis | Gamut, gamma, brightness, contrast, uniformity, color accuracy | Tested |
| Gray balance | Standard or iterative Deeper calibration | Standard tested; Deeper not tested |
| 3D LUT export | 17-, 33- or 65-point .cube, compatible workflows | Available but not exported or validated |
| StudioMatch / SpyderTune | Multi-display matching and visual fine-tuning | Available in SpyderPro software |
| Device Preview Plus / C2PA | Soft proofing, content-preview and provenance options | Visible in software; not evaluated |
Color Gamut: 100% sRGB and 94% DCI-P3
I started with gamut coverage because it tells me what colors the display can reach before I worry about how accurately it renders them. SpyderPro reported 100% sRGB, 94% DCI-P3 and 87% Adobe RGB on my Alienware. Dell lists 100% sRGB and 95% DCI-P3 as typical specifications, so my P3 measurement landed close to the advertised figure.
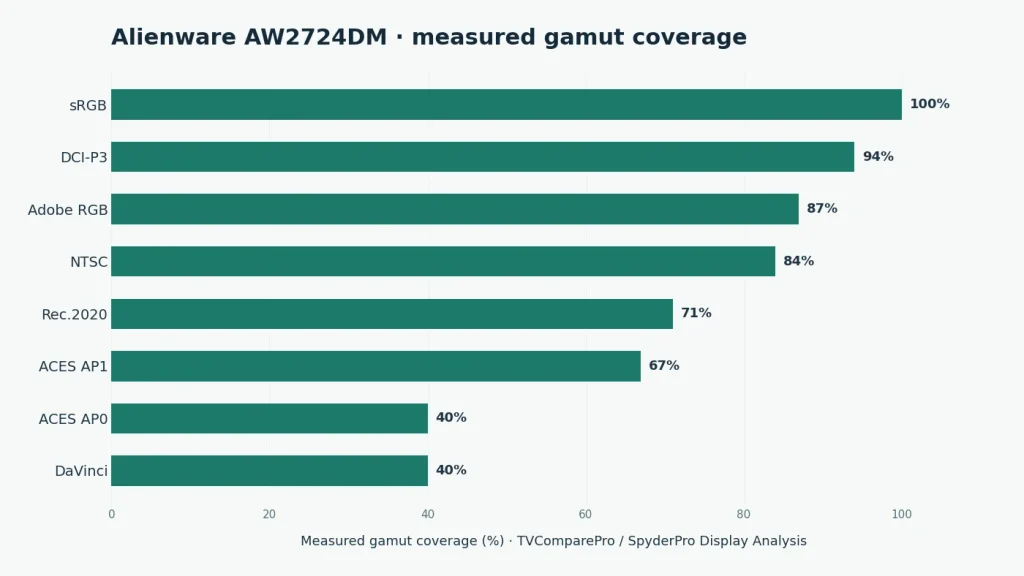
| Color space | Measured coverage |
|---|---|
| sRGB | 100% |
| Adobe RGB | 87% |
| DCI-P3 | 94% |
| NTSC | 84% |
| Rec.2020 | 71% |
| ACES AP1 | 67% |
| ACES AP0 | 40% |
| DaVinci | 40% |
The full sRGB result matters for web photos, graphic design and SDR content intended for broadly compatible screens. The 94% DCI-P3 coverage is useful when previewing wider-gamut material, though it is not a guarantee that every P3 color will be rendered accurately. A panel can cover an extensive gamut while having a poor white point or uneven gray balance. Gamut volume measures a different property again: the total space a display can reproduce, including extensions outside a reference boundary. SpyderPro’s percentages here describe coverage.
SDR Brightness: My Alienware Reached 381.5 Nits
This test gave me one of the clearest practical lessons of the session. In my first pass, I had not changed the physical OSD brightness properly between steps, and SpyderPro kept reporting roughly 191 nits. Those readings did not show the panel’s brightness range. I caught the mistake, changed the monitor’s real brightness control at each measurement point and repeated the test.
The valid second pass reached 381.5 nits at 100% OSD brightness. Dell specifies 400 nits as typical SDR brightness, meaning my reading was about 95.4% of that value, or 4.6% lower. That is a sensible comparison with the published typical figure, not evidence that the sensor or monitor is inaccurate by exactly 4.6%.
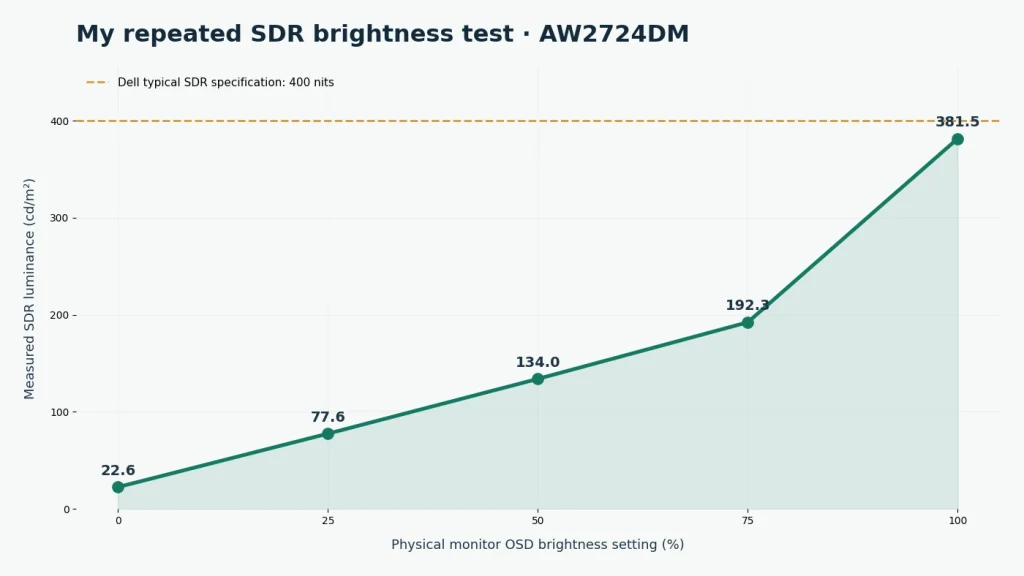
| OSD brightness | White luminance | Black level | Measured contrast | White point |
|---|---|---|---|---|
| 0% | 22.6 nits | 0.02 nits | 980:1 | 7200 K |
| 25% | 77.6 nits | 0.07 nits | 1120:1 | 7300 K |
| 50% | 134.0 nits | 0.14 nits | 950:1 | 7300 K |
| 75% | 192.3 nits | 0.19 nits | 1030:1 | 7400 K |
| 100% | 381.5 nits | 0.38 nits | 1010:1 | 7500 K |
The curve is not linear. Moving the slider from 75% to 100% raised the measured output by almost 190 nits, while the first three 25-point steps produced much smaller gains. The contrast results stayed broadly around the IPS panel’s quoted 1000:1 class, with minor variations between settings. That does not transform an edge-lit IPS screen into an OLED, nor should these SDR figures be confused with the monitor’s separate HDR peak-brightness specification.
White Point and Gamma Before Calibration
The monitor was already tracking the standard SDR gamma target quite well. Display Analysis reported roughly gamma 2.20, while the later profile overview recorded an uncalibrated value of 2.19. I did not find a major gamma problem that required dramatic correction.
The white point was another story. At the tested setting, SpyderPro indicated a correlated color temperature around 7400 K, with grayscale readings generally around 7100–7400 K. That is cooler than the D65 reference normally used for SDR photo and web work. A white page may still look neutral to your eyes after a few minutes, which is why relying on a subjective glance alone is not enough.
D65 is not just a temperature written as “6500 K”. It also corresponds to chromaticity coordinates near x=0.3127, y=0.3290 in the CIE 1931 xy diagram. Two displays can show similar correlated color temperatures and still have different green-magenta tints. I wanted the measured coordinates to move toward the target, rather than simply seeing the number 6500 in a menu.
Color Accuracy: The 12-Patch Report Before FullCAL
My initial SpyderPro Color Accuracy test reported an average Delta E of 1.77, a minimum of 0.27 and a maximum of 3.75 across 12 patches. That is a respectable average, although two entries exceeded 3.5 and another reached 3.50. The mean can easily disguise those more noticeable individual errors.
| Patch | Measured ΔE | Patch | Measured ΔE |
|---|---|---|---|
| 1E | 0.27 | 1F | 2.07 |
| 2E | 2.14 | 2F | 0.98 |
| 3E | 3.68 | 3F | 0.43 |
| 4E | 3.75 | 4F | 0.92 |
| 5E | 3.50 | 5F | 0.34 |
| 6E | 2.24 | 6F | 0.93 |
One methodological caution matters here: Datacolor explains that its Display Analysis tests generally disable the current monitor profile, but the Color Accuracy test is an exception. Unless a previously active profile and graphics calibration are independently ruled out, I cannot call 1.77 untouched factory accuracy. It is the initial result under the recorded test setup, and that is how I am treating it.
I also did not run a second complete 12-patch report after FullCAL. So you will not see an invented “before 1.77, after 0.6” comparison below. The 0.6 figure belongs to the calibrated white point, not the average error across these color patches.
Screen Uniformity: The Center Was Brighter
SpyderPro divided the image into nine regions. In the luminance test at its maximum test level, the center measured 190.8 nits, whereas the top-left was 166.9 nits. The software summarized the largest gap as approximately 13%. I could see why a uniformity test adds more context than a single brightness result: it describes the display area, not just the middle.
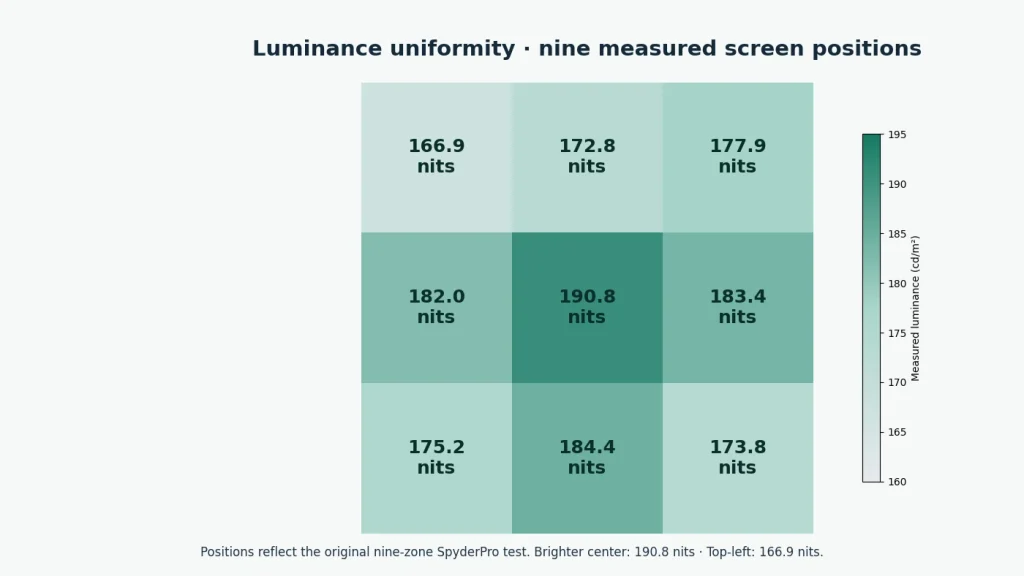
| Screen location | Measured luminance | Screen location | Measured luminance | Screen location | Measured luminance |
|---|---|---|---|---|---|
| Top-left | 166.9 | Top-center | 172.8 | Top-right | 177.9 |
| Middle-left | 182.0 | Center | 190.8 | Middle-right | 183.4 |
| Bottom-left | 175.2 | Bottom-center | 184.4 | Bottom-right | 173.8 |
Across additional uniformity test levels, the maximum luminance deviations were 13%, 14%, 15% and 16% at the software’s 100%, 83%, 67% and 50% test levels, respectively. These are SpyderPro uniformity-test levels, not the physical OSD brightness percentages in my earlier chart.
| SpyderPro uniformity test level | Maximum luminance deviation | Maximum recorded color deviation |
|---|---|---|
| 100% | 13% | Not supplied |
| 83% | 14% | ΔE 3.5 |
| 67% | 15% | ΔE 2.8 |
| 50% | 16% | ΔE 2.2 |
The color uniformity report recorded maximum Delta E values of 3.5, 2.8 and 2.2 at those three lower test levels. I do not have every individual color-uniformity cell value in the supplied records, so I will not draw a nine-zone color heatmap with guessed numbers. For photographers, the practical implication is that a white or gray area can change subtly as it moves across a screen. ICC calibration can improve the overall tone response and white point, but it cannot necessarily erase physical panel uniformity differences.
What SpyderPro’s 4/5 Monitor Rating Means
Datacolor’s Display Analysis also assigned the monitor an overall 4/5 rating. It is useful as a condensed view of this specific evaluation, but it is not my editorial score for either the SpyderPro or the Alienware. Its categories come from Datacolor’s system and cannot be mapped onto an RTINGS or TFTCentral rating.
| Datacolor category | SpyderPro rating |
|---|---|
| Gamut | 5/5 |
| Tone Response | 5/5 |
| White Point | 3/5 |
| Contrast | 5/5 |
| Luminance Uniformity | 3/5 |
| Color Uniformity | 4.5/5 |
| Color Accuracy | 4/5 |
| Overall | 4/5 |
Those 3/5 figures for white point and luminance uniformity match the weaknesses I found most interesting. A display can score very well on gamut coverage and gamma tracking while still having a cooler-than-target white and uneven brightness across the panel.
The FullCAL Calibration I Actually Performed
After the baseline measurements, I went back through the SpyderPro wizard and performed a full calibration. I selected gamma 2.2 and white point 6500 K. I left brightness at Do Not Adjust, turned room-light compensation off and chose Standard gray balance. I did not enable Deeper calibration or 3D LUT export.
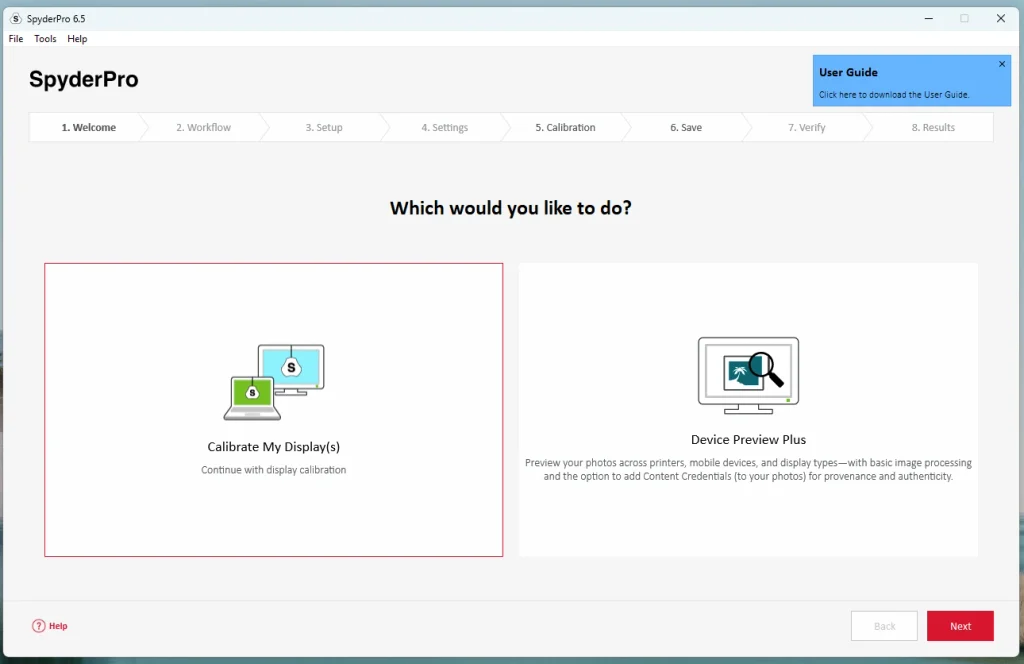
| SpyderPro setting | My selected value |
|---|---|
| Calibration mode | FullCAL |
| Display | Dell AW2724DM |
| Technology | Wide LED |
| Picture preset | Standard |
| Target gamma | 2.2 |
| Target white point | 6500 K |
| Brightness | Do Not Adjust |
| Room light | Off |
| Advanced target | Custom |
| Gray Balance Calibration | Standard |
| Deeper Calibration | Not performed |
| 3D LUT Export | Off |
| Manual RGB adjustments | None |
The software showed successive colored patches while the SpyderPro read the screen. At the end I saved the generated display profile and used SpyderProof to compare the calibrated and uncalibrated views. This is software-based display calibration and ICC profiling, not a rewrite of the monitor’s internal factory LUT. It also was not a fixed 120-nit or 140-nit session, because I specifically left the brightness target at “Do Not Adjust”.
After Calibration: Much Closer to D65, with Gamma Still on Target
The Profile Overview is where the useful result became obvious. Before calibration, the recorded white-point coordinates were x=0.302, y=0.312. After FullCAL they moved to x=0.313, y=0.330, very close to the software’s rounded D65 target of x=0.313, y=0.329. Datacolor reported white-point Delta E (Lab) 0.6 and a 50% gray Delta E of 0.2.
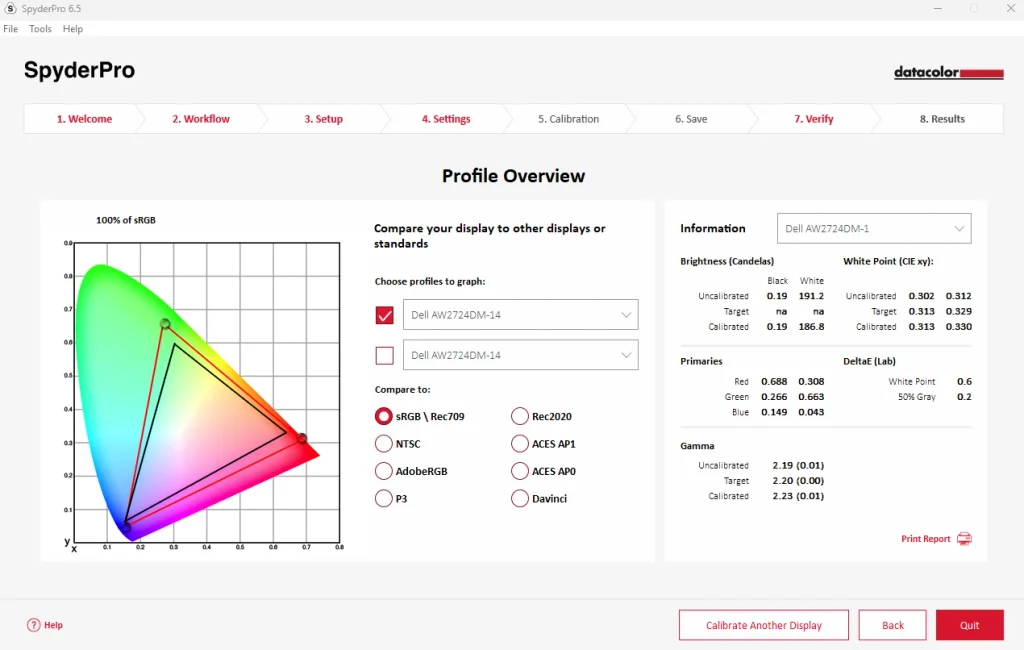
| Profile Overview measurement | Before calibration | After FullCAL |
|---|---|---|
| White-point x | 0.302 | 0.313 |
| White-point y | 0.312 | 0.330 |
| Gamma | 2.19 | 2.23 |
| White luminance | 191.2 nits | 186.8 nits |
| Black level | 0.19 nits | 0.19 nits |
| White-point ΔE (Lab) | Not supplied | 0.6 |
| 50% gray ΔE (Lab) | Not supplied | 0.2 |
The gamma result is also worth interpreting correctly. The target was 2.20 and I obtained 2.23, which is close but not mathematically identical. White luminance shifted slightly from 191.2 to 186.8 nits under this profile-overview measurement condition. That is not inconsistent with my separate 381.5-nit maximum SDR result, which was taken with the OSD at 100%.
This is a meaningful, documented improvement in the measured white-point coordinates. It is not proof that every color patch is now below Delta E 1, because I did not supply a post-calibration full color-accuracy run.
What Happens When You Enable Windows HDR?
SpyderPro works with Windows 11 to calibrate SDR displays and create ICC color profiles. When HDR is enabled, Windows uses a different color-management process, which can change how the desktop looks. In my case, colors appeared less saturated than in SDR.
For everyday desktop work, I recommend using the calibrated SDR profile and enabling HDR when watching or working with HDR content.
SpyderPro’s 12,000-Nit Measurement Capability
Datacolor rates the SpyderPro sensor for luminance measurements up to 12,000 nits, making it suitable for measuring modern OLED, Mini LED and high-brightness displays.
This measurement range is separate from the standard SDR ICC calibration workflow. Advanced HDR evaluation also requires compatible software and appropriate HDR test patterns.
Deeper Calibration and 3D LUT Export
SpyderPro offers a Deeper Calibration option with additional grayscale measurements for more detailed calibration.
It also supports 17-, 33- and 65-point 3D LUT exports in .cube format, useful for compatible video-editing applications and professional display workflows. These features extend SpyderPro beyond basic monitor profiling, particularly for content creators who need more control over color reproduction.ult can be wrong. Datacolor warns against double profiling. I did not generate, load or validate a LUT in this review, so I consider it a useful available feature rather than one of my tested results.
SpyderPro vs Spyder and Calibrite: Where the Differences Matter
The closest alternatives are the less expensive Datacolor Spyder and Calibrite’s Display Pro HL and Display Plus HL. I have not run a head-to-head sensor accuracy experiment with these devices. The table compares published capabilities, not an invented benchmark of their measured precision.
| Product | Advertised maximum luminance | Relevant positioning |
|---|---|---|
| Datacolor SpyderExpress | 1,200 nits | Basic display calibration; limited options |
| Datacolor Spyder (2024) | 3,000 nits | OLED/mini-LED-compatible ICC workflow, fewer advanced tools |
| Datacolor SpyderPro (2024) | 12,000 nits | Custom targets, advanced display analysis, multi-display features, .cube 3D LUT |
| Calibrite Display Pro HL | 3,000 nits | Calibrite PROFILER; modern display types; third-party support varies |
| Calibrite Display Plus HL | 10,000 nits | Higher-luminance professional workflows, Calibrite PROFILER |
On paper, SpyderPro offers the highest advertised luminance ceiling in this group. That tells me its stated measurement range, not whether it will read a particular OLED panel more accurately than a Calibrite sensor. Calibrite has its own profiling ecosystem and some workflows may benefit from specific hardware or third-party software support. I would choose based on the actual display, software and output path before using maximum nits as the tie-breaker.
Who I Would Recommend It To
For photographers editing SDR images, a monitor that already covers sRGB but has a cooler white point is exactly the sort of practical case where a colorimeter earns its place. In my test, I got a precise record of the starting condition, could explain the brightness and uniformity behavior, and finished with a measured white point close to D65. That is more useful than choosing a color-temperature preset by eye.
I also see the value for people who maintain several displays or work with wide-gamut material. The software can do more than make a single ICC profile. The caveat is that some of those features, including 3D LUTs and Deeper calibration, take knowledge and a compatible workflow; I would not present them as automatic improvements.
For gamers who mostly want HDR to look more colorful, I would be more cautious. My Windows HDR experience was not a success story, and I have not demonstrated a complete HDR calibration on either this Fast IPS monitor or an OLED. If that is the main reason you are spending money, first verify that the exact software and display combination supports the HDR calibration method you need.
The same SpyderPro I used for my hands-on calibration tests. Supports LCD, OLED, QD-OLED and Mini LED displays, with ICC profiling, display analysis and 3D LUT export. Its sensor is rated for luminance measurements up to 12,000 nits.
Check on AmazonWould I Keep Using the SpyderPro?
Yes, for the SDR measurement and profiling work I actually completed. The strongest part of my test was not the 12,000-nit marketing number. It was being able to measure a familiar monitor in several different ways, catch a brightness-test mistake, and see the white point move from x=0.302/y=0.312 to x=0.313/y=0.330 after FullCAL. That is a result I can show rather than simply describe as “better colors”.
The software was not flawless for me, particularly around SpyderUtility and the switch to Windows HDR. I also have not checked Deeper calibration, third-party accuracy against a reference instrument, or 3D LUT performance. With those limits stated, SpyderPro is a convincing tool for detailed SDR display analysis and ICC profiling. I would buy it for that measured, repeatable workflow, not on the assumption that a 12,000-nit sensor automatically gives me a fully calibrated HDR television.
Review disclosure: Datacolor supplied the SpyderPro review unit for testing. My findings and conclusions are my own.